Picture this: You’ve built a fantastic web application backed by a PostgreSQL database that’s gaining users by the day. Traffic is growing, you’re scaling horizontally with multiple app instances, and everything seems great until your database starts gasping for air.
The problem? Each time your application talks to PostgreSQL, it opens a new connection; it’s like hiring a dedicated assistant for every single conversation, even if that conversation lasts just milliseconds.
Let’s explore why this happens and how connection pooling with PgBouncer can save the day.
The hidden cost of database connections
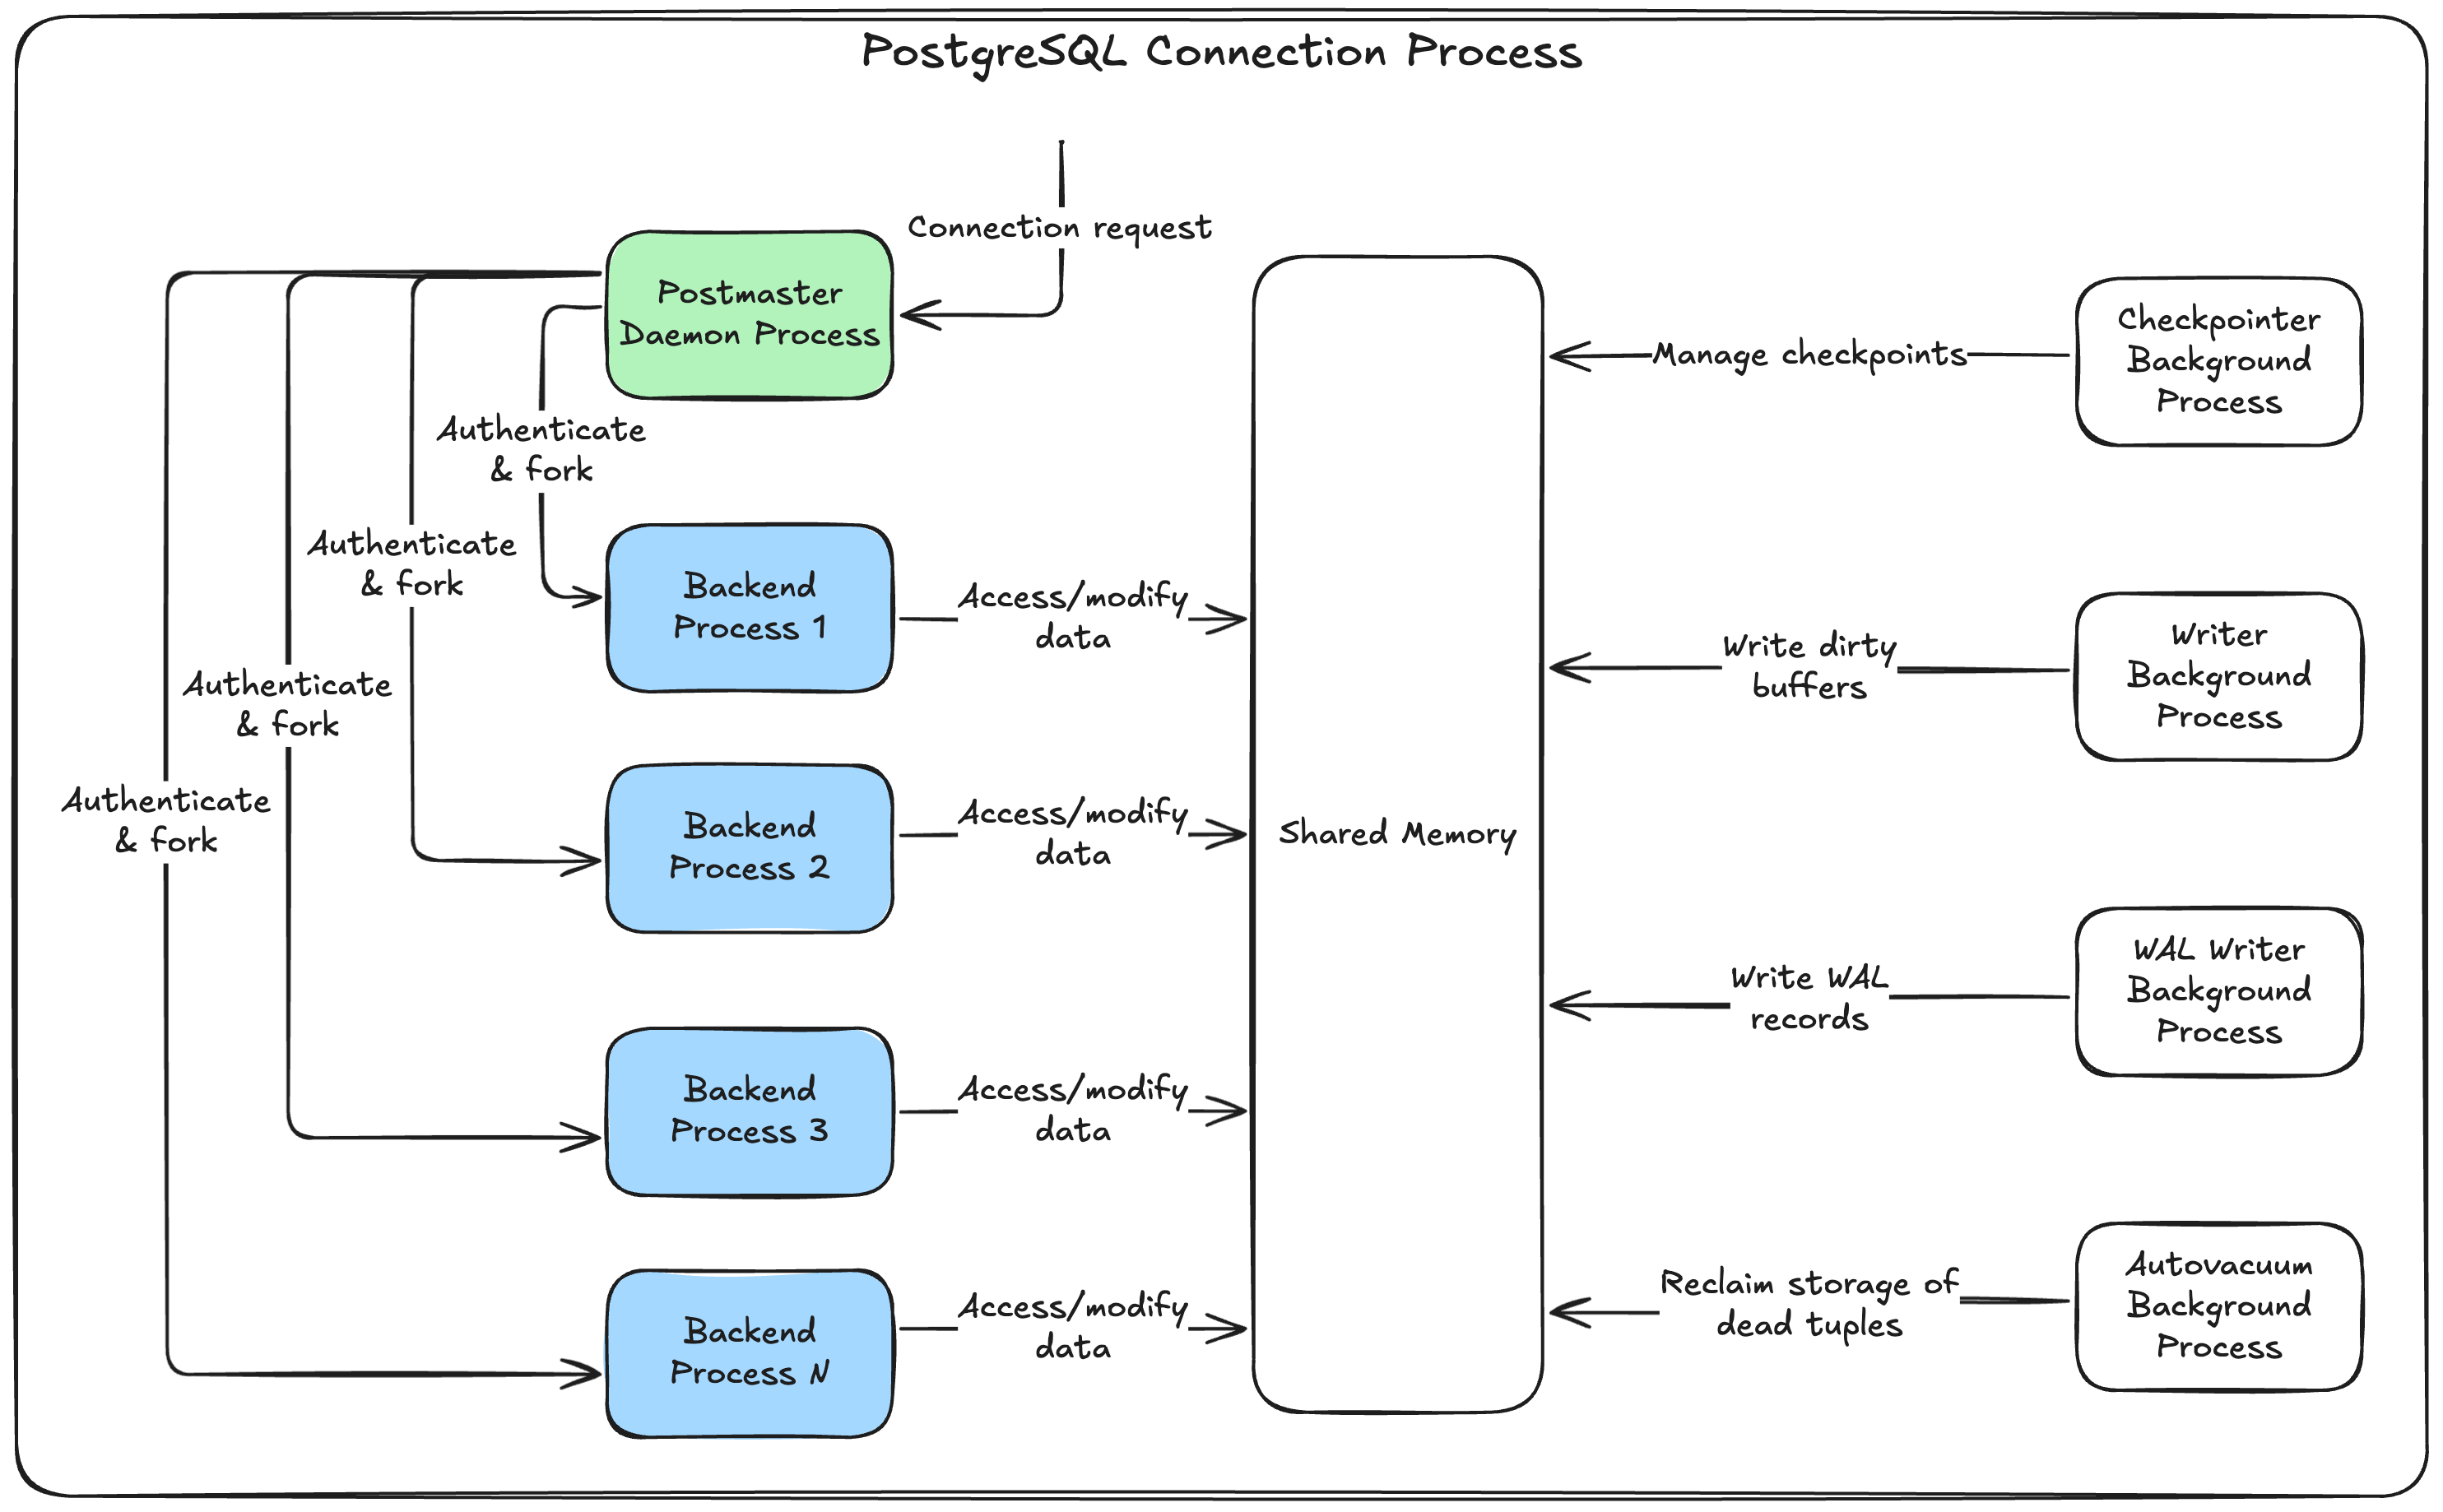
When your application opens a connection to PostgreSQL, you might think it’s a lightweight operation. It’s not.
Behind the scenes, PostgreSQL creates a dedicated process for each connection. This process gets its own slice of memory, CPU resources, and file descriptors from the operating system. Creating and destroying these processes is expensive.
Let’s put this into perspective with a real scenario. Imagine you have:
- A web app with 3 instances (scaled horizontally)
- Each instance handles 100 requests per second
- Each request makes 2 database queries
- Each query takes 10ms to complete
Without connection pooling, you’re opening and closing 600 database connections per second. That’s 600 processes being created and destroyed every single second!
For PostgreSQL, this means:
- Memory allocation for each process (~8MB per connection in default PostgreSQL)
- CPU overhead for process creation and context switching
- File descriptor consumption (limited by the OS)
- Lock contention as processes compete for shared resources
As your traffic grows, your database server will eventually hit its connection limit. PostgreSQL’s default max_connections setting is typically 100, after which it starts rejecting new connections. Your application crashes, and your users see error pages.
“Easy fix,” you might think, “just increase max_connections to 500 or 1000!” Unfortunately, it’s not that simple. PostgreSQL allocates shared memory and other resources based on the max_connections value. More connections means more memory usage, even when those connections aren’t active.
PostgreSQL sizes certain resources based directly on the value of max_connections. Increasing its value leads to higher allocation of those resources, including shared memory. — PostgreSQL documentation
The result? Your database server might run out of memory or become slow due to resource contention, even if only a fraction of those connections are actually being used.
Enter connection pooling: The smart solution
Connection pooling is like having a taxi service instead of buying a new car for every trip. Instead of creating connections on-demand, we maintain a small pool of reusable connections that get shared across requests.
Here’s how it works:
- Maintain a pool: Keep a small number of connections open (say, 10-20 instead of hundreds).
- Reuse connections: When a request needs the database, it uses a connection from the pool (if available or wait for one to be available).
- Return when done: After the query completes, the connection goes back to the pool for the next request.
- Connection management: Automatically handle connection health, timeouts, and cleanup.
This reduces the overhead on your database server while maintaining the same performance for your application (if you managed to get the right pool size).
Meet PgBouncer: PostgreSQL’s connection pooler
PgBouncer is a lightweight connection pooler that sits between your application and PostgreSQL database. Think of it as a smart traffic controller that manages the flow of database connections.
While there are other options like pgpool, Odyssey, and PgCat, PgBouncer has earned its reputation as the most battle-tested and widely adopted in the PostgreSQL ecosystem.
Each provides different features and capabilities, but comparing them is beyond the scope of this post. For most use cases, PgBouncer is an excellent choice.
PgBouncer in action
Here’s what happens when your application talks to PostgreSQL through PgBouncer:
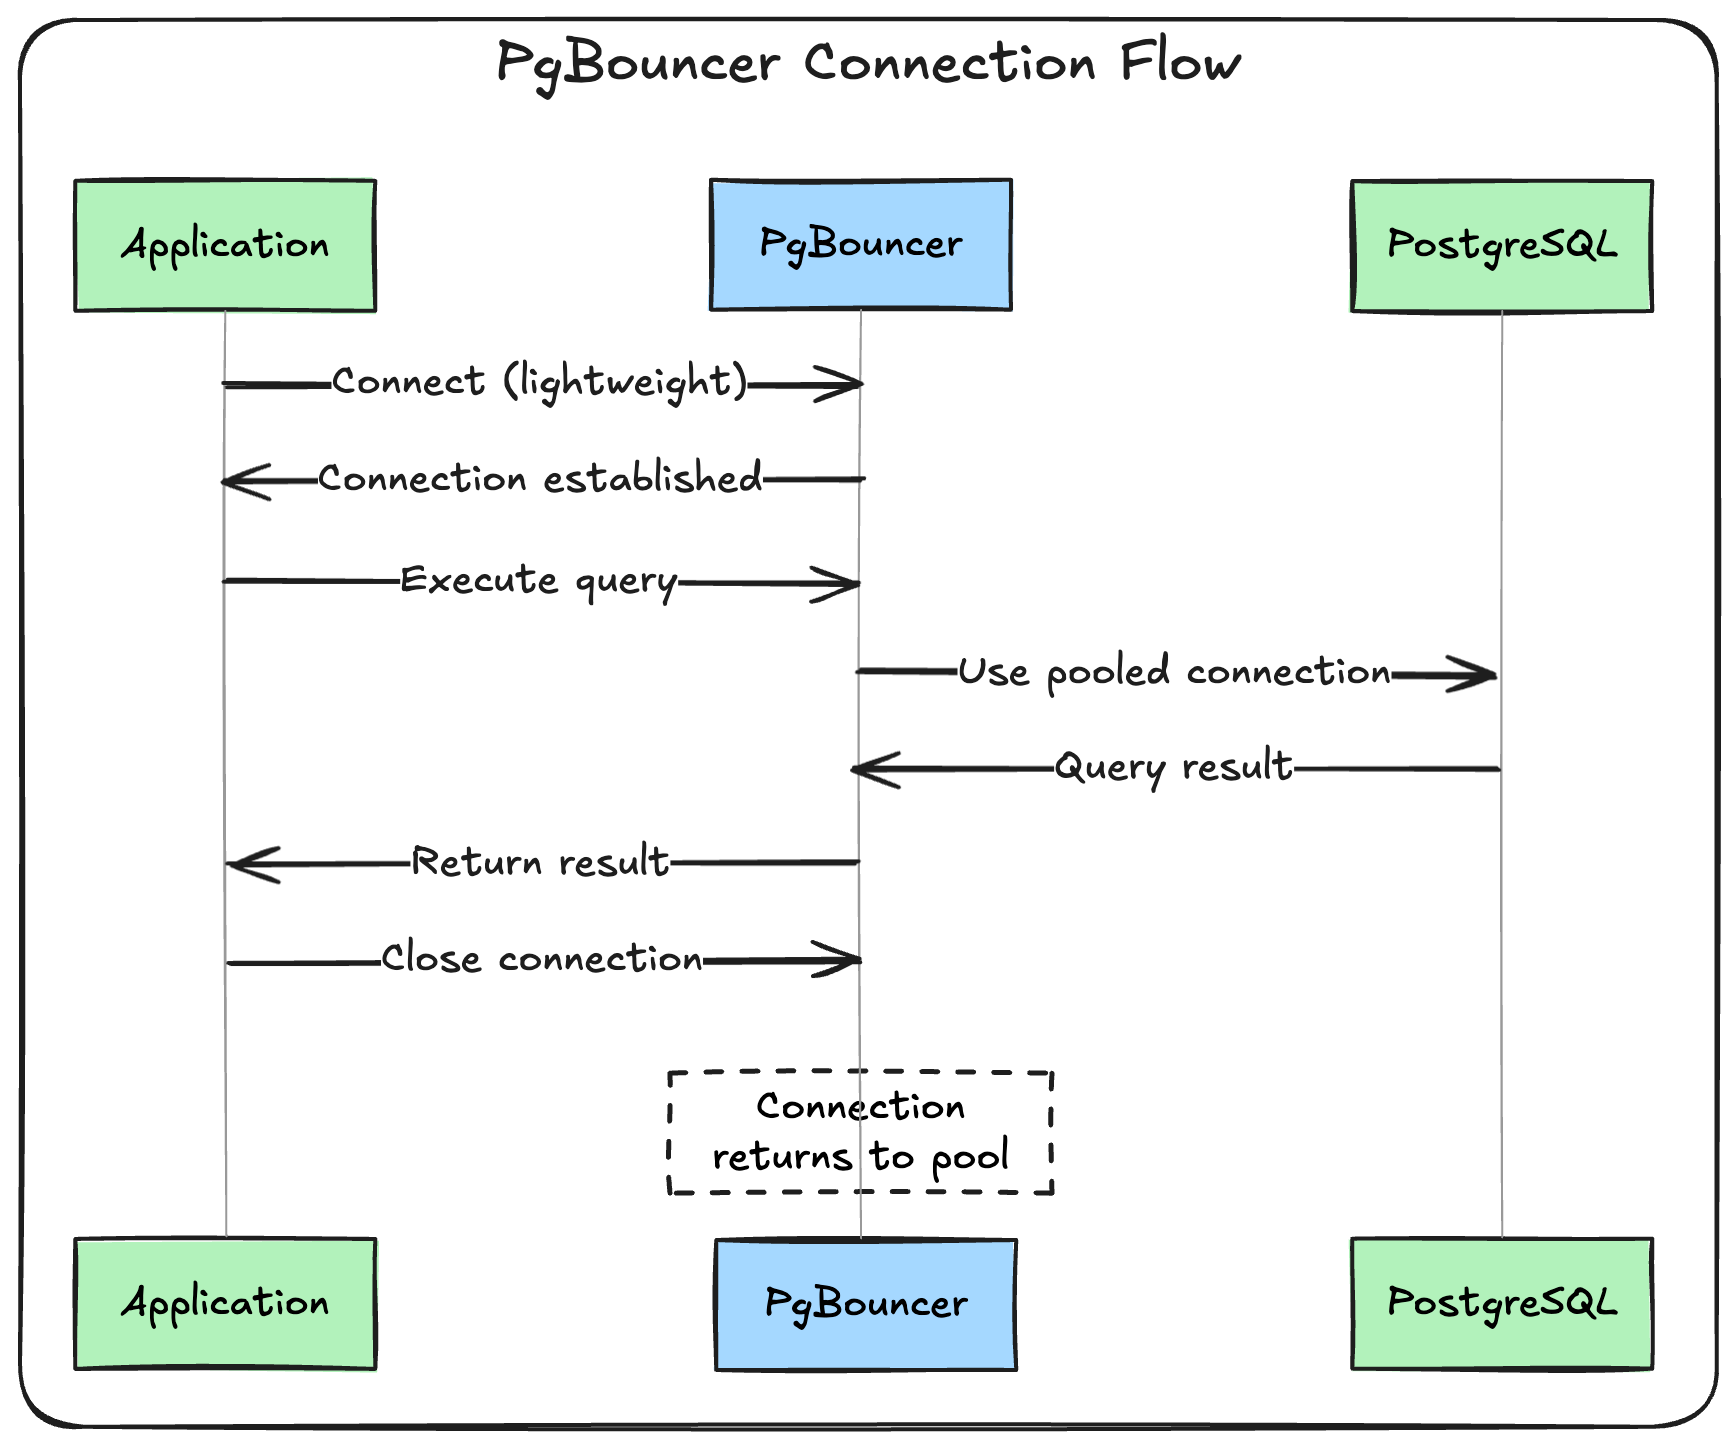
The magic happens in that last step. When your application “closes” the connection, PgBouncer doesn’t actually close the connection to PostgreSQL. Instead, it keeps it alive in the pool, ready for the next request.
How client-side pooling falls short
You might wonder: “My framework already has connection pooling. Isn’t that enough?”
Client-side pooling (like Rails’ ActiveRecord connection pool) works well for single-server applications, but it has a critical flaw in distributed systems: it multiplies with your application instances.
Let’s say you configure each app instance with a pool of 10-25 connections:
- 1 app instance = 10-25 database connections.
- 5 app instances = 50-125 database connections.
- 10 app instances = 100-250 database connections.
- 20 app instances = 200-500 database connections 💥.
Your database drowns in connections again, just from a different angle.
With PgBouncer, all your application instances share the same small pool of database connections. Whether you have 1 app instance or 100, your database still only sees the same 10-20 connections.
PgBouncer’s pooling modes
PgBouncer offers three different pooling modes, each with different trade-offs between connection efficiency and functionality:
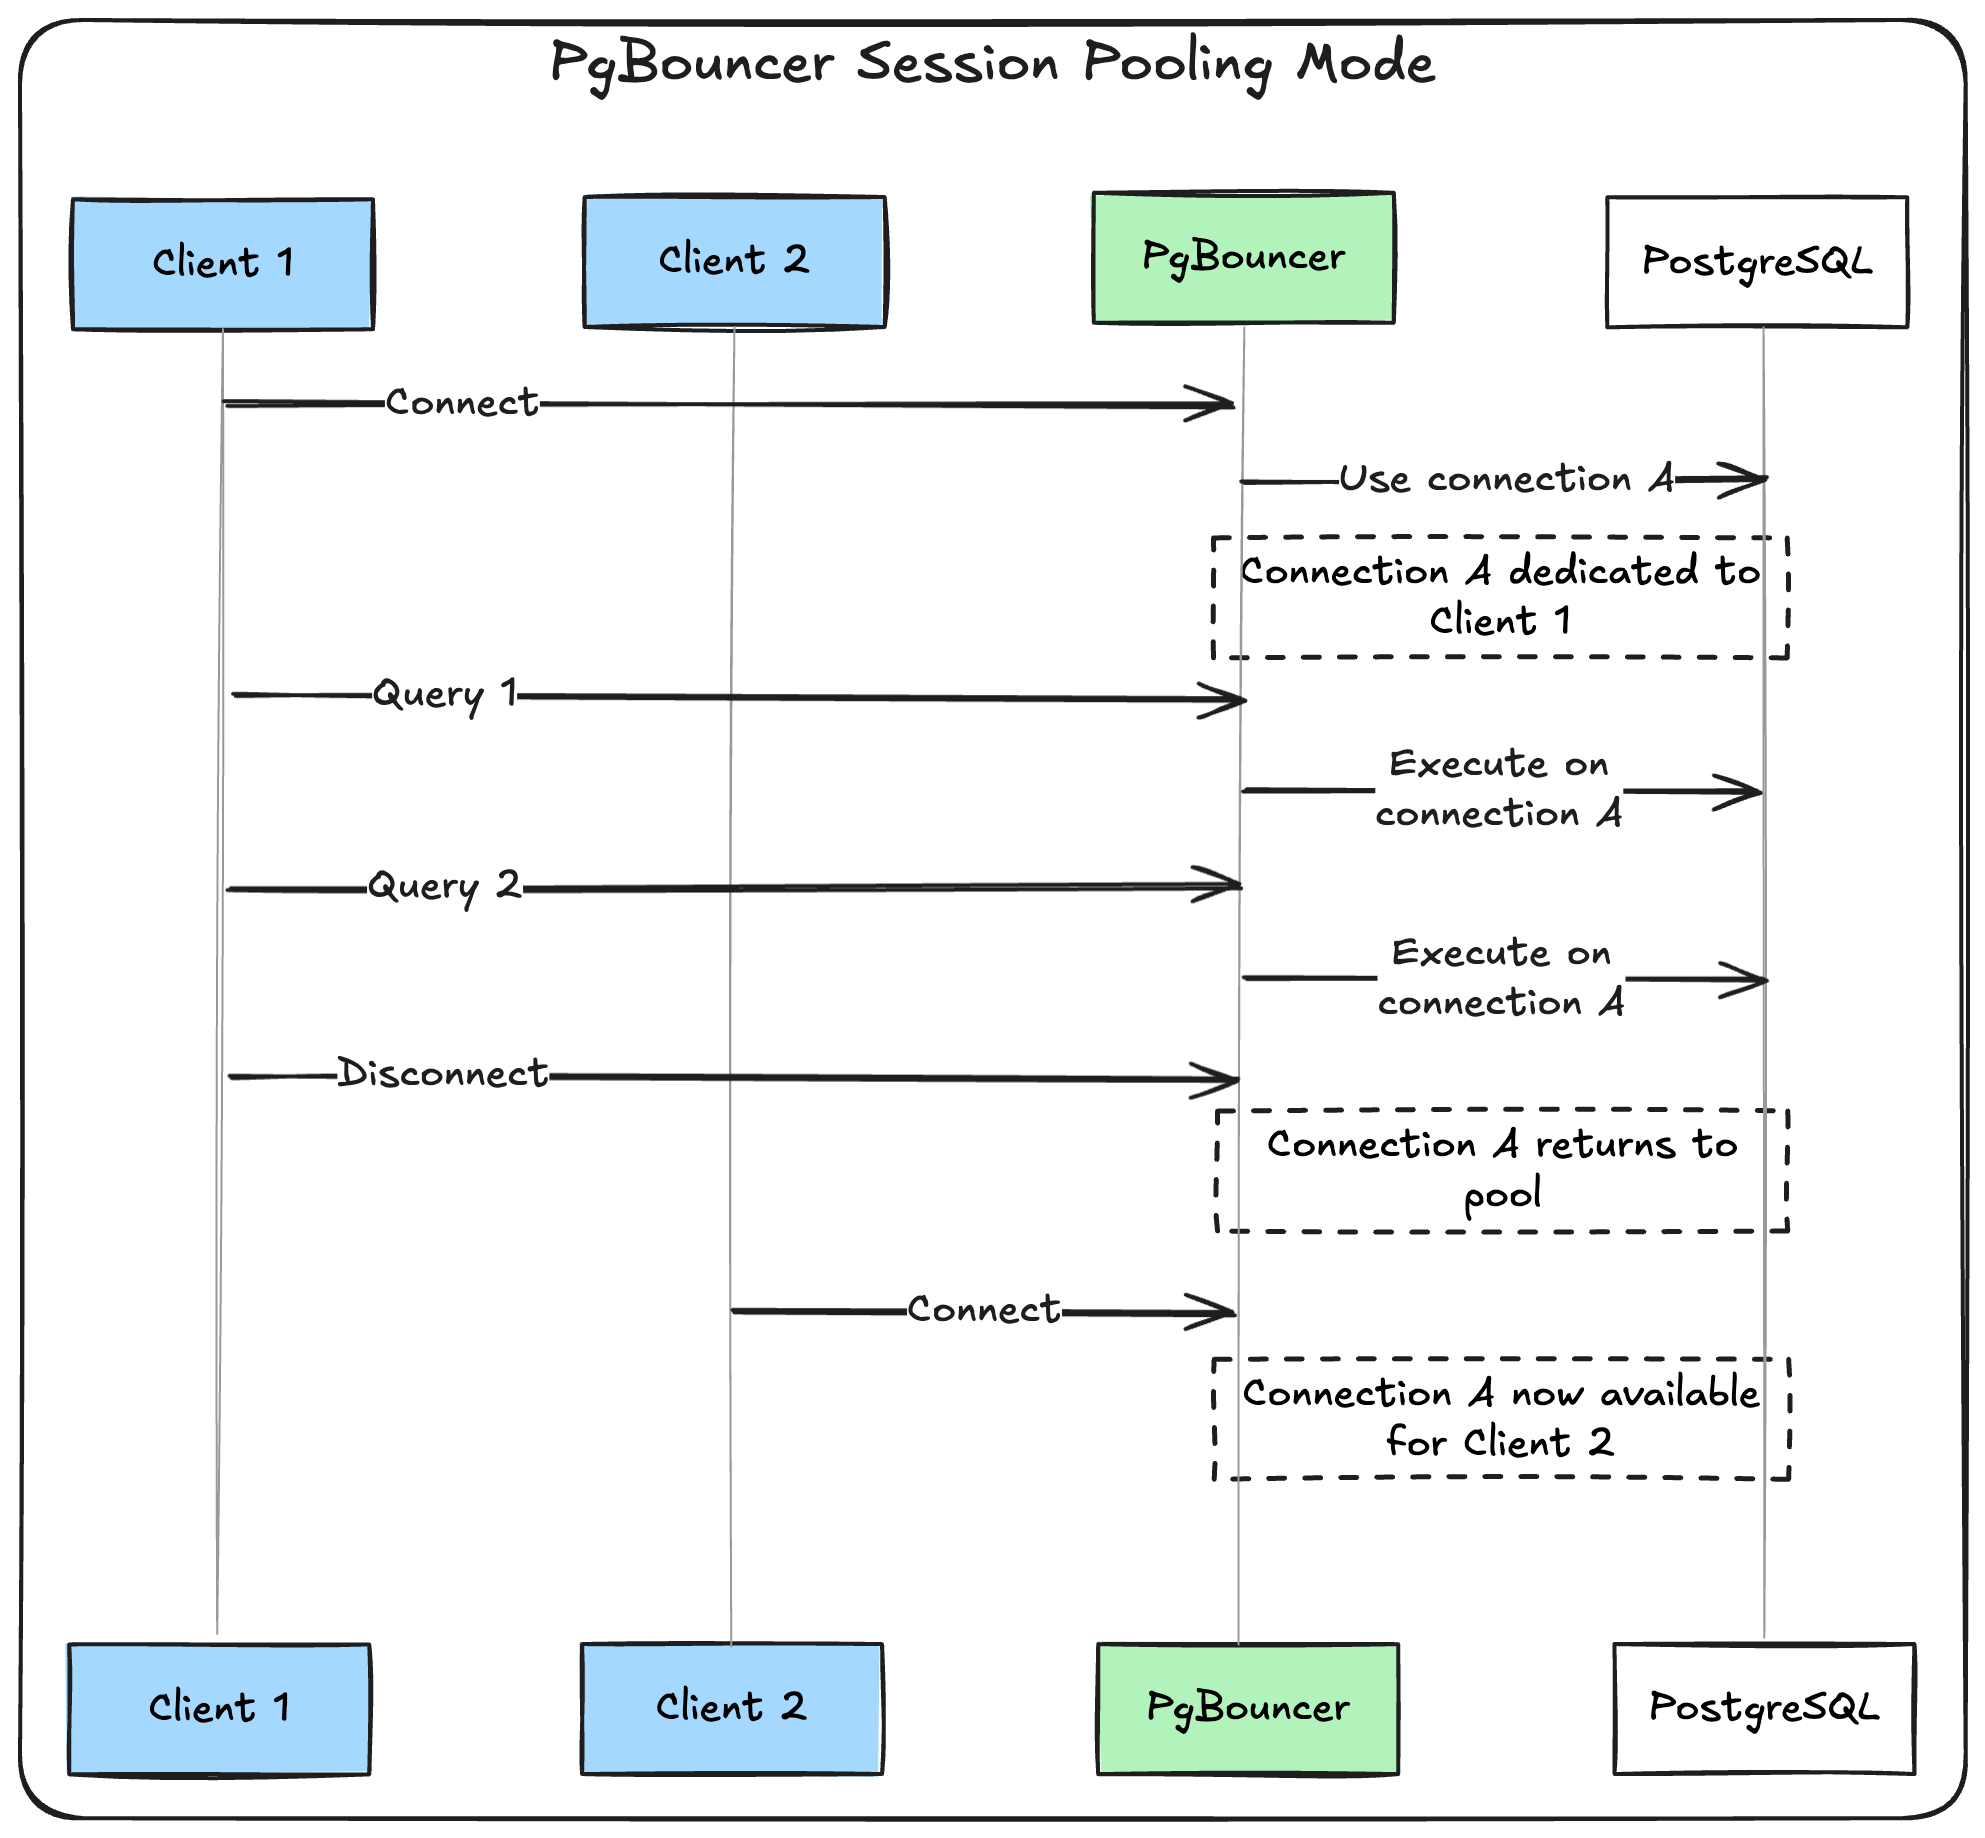
Session pooling (safest, default)
In session mode, PgBouncer assigns a database connection to a client for the entire duration of their session. This is the safest mode because it preserves all PostgreSQL features.
When to use: When you need full PostgreSQL compatibility (prepared statements, transactions, temp tables).
Transaction pooling (more efficient)
In transaction mode, PgBouncer assigns a database connection only for the duration of a transaction. Between transactions, the connection can be shared with other clients.
When to use: When your application doesn’t rely on session-level features and you want better connection utilization.
Limitations: No prepared statements, advisory locks, or session-level settings.
Statement pooling (most aggressive)
In statement mode, connections are returned to the pool immediately after each statement. This provides maximum connection reuse but breaks many PostgreSQL features.
When to use: Rarely. Only for simple, stateless queries where maximum connection efficiency is critical.
Limitations: No transactions, prepared statements, or any session state.
Recommendation: Start with session pooling. Most applications work fine with it, and you can always optimize later if needed.
Setting up PgBouncer
Here’s a basic PgBouncer configuration to get you started:
    [databases]
myapp = host=localhost port=5432 dbname=myapp_production

[pgbouncer]
pool_mode = session
listen_port = 6432
listen_addr = 0.0.0.0
auth_type = md5
auth_file = userlist.txt

# Connection pool settings
default_pool_size = 20
max_client_conn = 100
reserve_pool_size = 5

# Timeouts
server_connect_timeout = 15
server_login_retry = 3
query_timeout = 0

# Logging
log_connections = 1
log_disconnections = 1
Key settings are:
default_pool_size: Number of connections PgBouncer maintains to PostgreSQL.max_client_conn: Maximum connections PgBouncer accepts from clients. It is recommended to match your database’smax_connectionssetting. When the pool is full, connections will queue up to this limit.pool_mode: Choose between session, transaction, or statement pooling.reserve_pool_size: Additional server connections beyond thedefault_pool_sizethat PgBouncer can create when clients are waiting. Only used when a client connection is waiting for a server connection for a specified duration, defined byreserve_pool_timeout.
Monitoring your connection pool
Once PgBouncer is running, you can monitor it through its admin interface:
    -- Connect to PgBouncer admin
psql -h localhost -p 6432 -U pgbouncer pgbouncer

-- Show pool status
SHOW POOLS;

-- Show client connections
SHOW CLIENTS;

-- Show server connections
SHOW SERVERS;

-- Show configuration
SHOW CONFIG;
Watch for these key metrics:
- Pool utilization: Look at
cl_activevsmaxwaitinSHOW POOLS. If you consistently see high active connections and clients waiting, increasedefault_pool_size. - Client wait time: Check
SHOW CLIENTSfor clients stuck in “waiting” state. Long waits usually mean your pool is too small or your queries are too slow. - Connection churn: Monitor how often PgBouncer creates new server connections. High churn (frequent connect/disconnect) means your pool size doesn’t match your workload - either too small (forcing new connections) or applications aren’t reusing connections properly.
- Query duration: Monitor
avg_query_timeinSHOW STATS. Sudden increases might indicate slow queries that are hogging connections.
Benchmarking the impact
To demonstrate PgBouncer’s performance benefits, I ran benchmarks using PostgreSQL’s pgbench tool with different load scenarios.
    # docker-compose.yml
services:
  postgres:
    image: postgres:15
    ports:
      - "5432:5432"
    environment:
      POSTGRES_DB: pgbench_test
      POSTGRES_USER: user
      POSTGRES_PASSWORD: pass

  pgbouncer:
    image: edoburu/pgbouncer:latest
    volumes:
      - ./pgbouncer/pgbouncer.ini:/etc/pgbouncer/pgbouncer.ini
      - ./pgbouncer/userlist.txt:/etc/pgbouncer/userlist.txt
    command: pgbouncer /etc/pgbouncer/pgbouncer.ini
    ports:
      - "6432:6432"

  pgbench:
    image: postgres:15
    environment:
      PGPASSWORD: pass
    volumes:
      - ./run_benchmark.sh:/run_benchmark.sh
    command: /run_benchmark.sh
Note: The code snippets provided here are simplified, you can find the complete benchmarking docker compose file and script on this repo.
Here are the key results for the benchmarks:
Light Load (10 clients, 200 transactions each)
    pgbench -h postgres -p 5432 -U user -d pgbench_test -c 10 -t 200 -r --connect
pgbench -h pgbouncer -p 6432 -U user -d pgbench_test -c 10 -t 200 -r --connect
Direct PostgreSQL connection:
    tps = 243.1 (including reconnection times)
average connection time = 3.879 ms
latency average = 41.136 ms
Through PgBouncer:
    tps = 1695.4 (including reconnection times)
average connection time = 0.393 ms
latency average = 5.898 ms
Result: PgBouncer delivers 7.0x higher TPS and 9.9x faster connections!
Heavy Load (50 clients, 1000 transactions each)
    pgbench -h postgres -p 5432 -U user -d pgbench_test -c 50 -t 1000 -r --connect
pgbench -h pgbouncer -p 6432 -U user -d pgbench_test -c 50 -t 1000 -r --connect
Direct PostgreSQL connection:
    tps = 226.9 (including reconnection times)
average connection time = 4.226 ms
latency average = 220.398 ms
Through PgBouncer:
    tps = 779.0 (including reconnection times)
average connection time = 1.090 ms
latency average = 64.184 ms
Result: PgBouncer delivers 3.4x higher TPS and 3.9x faster connections!
Stress Test (80 clients, 60-second duration)
    pgbench -h postgres -p 5432 -U user -d pgbench_test -c 80 -T 60 -r --connect
pgbench -h pgbouncer -p 6432 -U user -d pgbench_test -c 80 -T 60 -r --connect
Direct PostgreSQL connection:
    tps = 228.5 (including reconnection times)
average connection time = 4.179 ms
latency average = 350.040 ms
transactions processed = 13718
Through PgBouncer:
    tps = 1063.3 (including reconnection times)
average connection time = 0.742 ms
latency average = 75.235 ms
transactions processed = 28376
Result: PgBouncer delivers 4.7x higher TPS and 5.6x faster connections with 2.1x more transactions completed!
As you can see, PgBouncer provides HUGE performance improvements:
- TPS improvement: 3.4x to 7.0x higher throughput.
- Connection speed: 3.9x to 9.9x faster connection establishment.
- Latency reduction: Up to 7x lower query latency.
- Stress test: Completed 2.1x more transactions under high load.
The bottom line
If you are building a high-scale application, connection pooling is one of those tools that quietly makes everything better.
The benefits are clear:
- Reduced resource usage: Fewer processes, less memory, better CPU utilization.
- Improved scalability: Add more app instances without drowning your database.
- Easier monitoring: Centralized view of database connection usage.
Start with session pooling in a centralized deployment, monitor your connection usage, and adjust as your application grows. Your database (and your users) will thank you.

Author
Kareem Mohllal
Writing stories about the world for the machine; sometimes it understands.
kareem.mohllal@gmail.com
Comments